ProteomeUI

Explore RNA and
protein expression

in mouse somitogenesis

Launch Explorer
ProteomeUI infographic and tool preview

No Coding Needed

Interactively visualize spatial and spatiotemporal gene expression patterns in somitogenesis.

Somitogenesis is a complex process in embryonic development, generally arrived through a clock and wavefront model. The wavefront is determined by gradients, while the clock is so far known as a travelling wave of gene expression through the presomitic mesoderm (PSM). To investigate the components of this process, we have combined RNA sequencing and proteomics for a comprehensive study of gene and protein expression in somitogenesis.

Source of This Data

Interested in the methods? Check out our paper:

Spatiotemporal proteomics reveals dynamic antagonistic gradients shaping signalling waves

Wilke H. M. Meijer, Virginia Andrade, Suzan Stelloo, Wouter M. Thomas, Marek J. van Oostrom, Eveline F. Ilcken, Kim T. J. Peters, Michiel Vermeulen, Katharina F. Sonnen

bioRxiv 2025.09.05.674076
doi: 10.1101/2025.09.05.674076

Investigating the gradients that make up the wavefront in somitogenesis

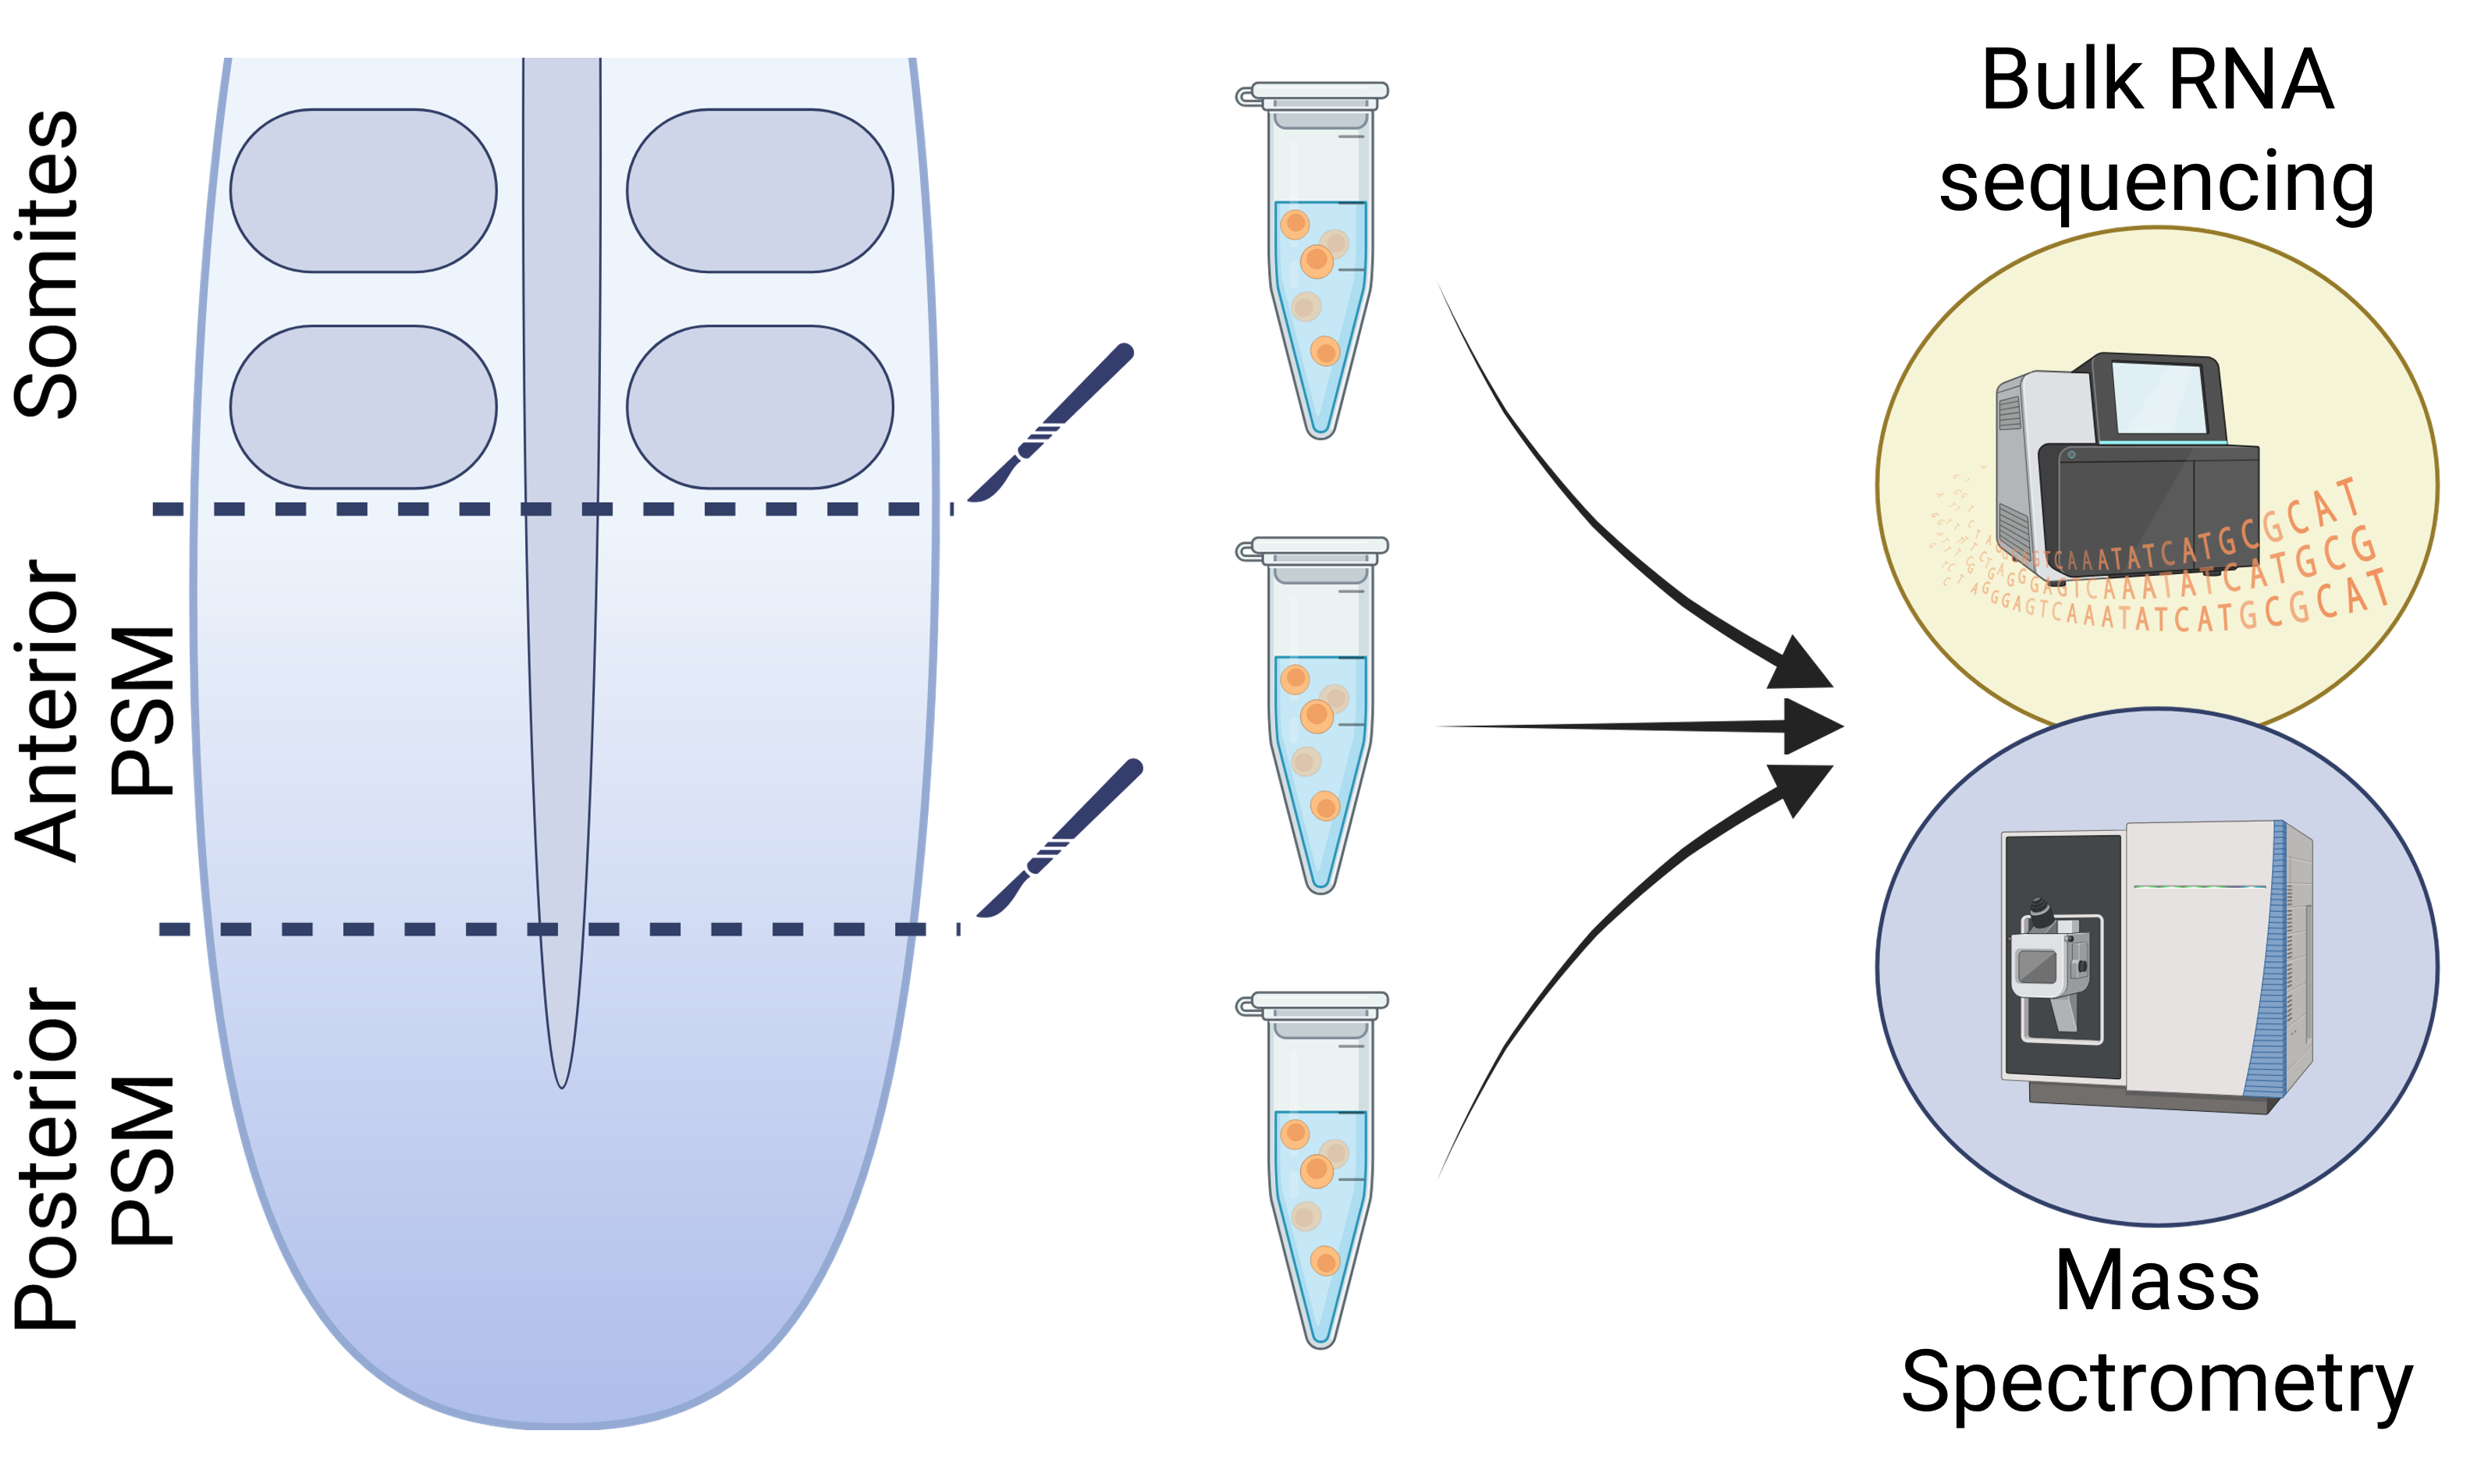
To investigate genes and proteins that could play a role in giving positional information to cells in the PSM, we separated the PSM into 3 regions; posterior PSM (p-PSM), anterior PSM (a-PSM), and Somite regions. We then pooled 8 tails per region and performed RNA sequencing and proteomics to get a comprehensive overview of gene and protein expression in these regions. With this data, we can investigate the gradients that make up the wavefront in somitogenesis.

In addition to this, we performed differential expression analysis to identify genes and proteins that are differentially expressed between these regions, which could be important for the wavefront and somitogenesis in general. Lastly, we also calculated the correlation between RNA and protein expression (Rho score) for each gene, to investigate the relationship between RNA and protein expression in these regions.
Spatial method
Spatial data methods graphic
Spatiotemporal method
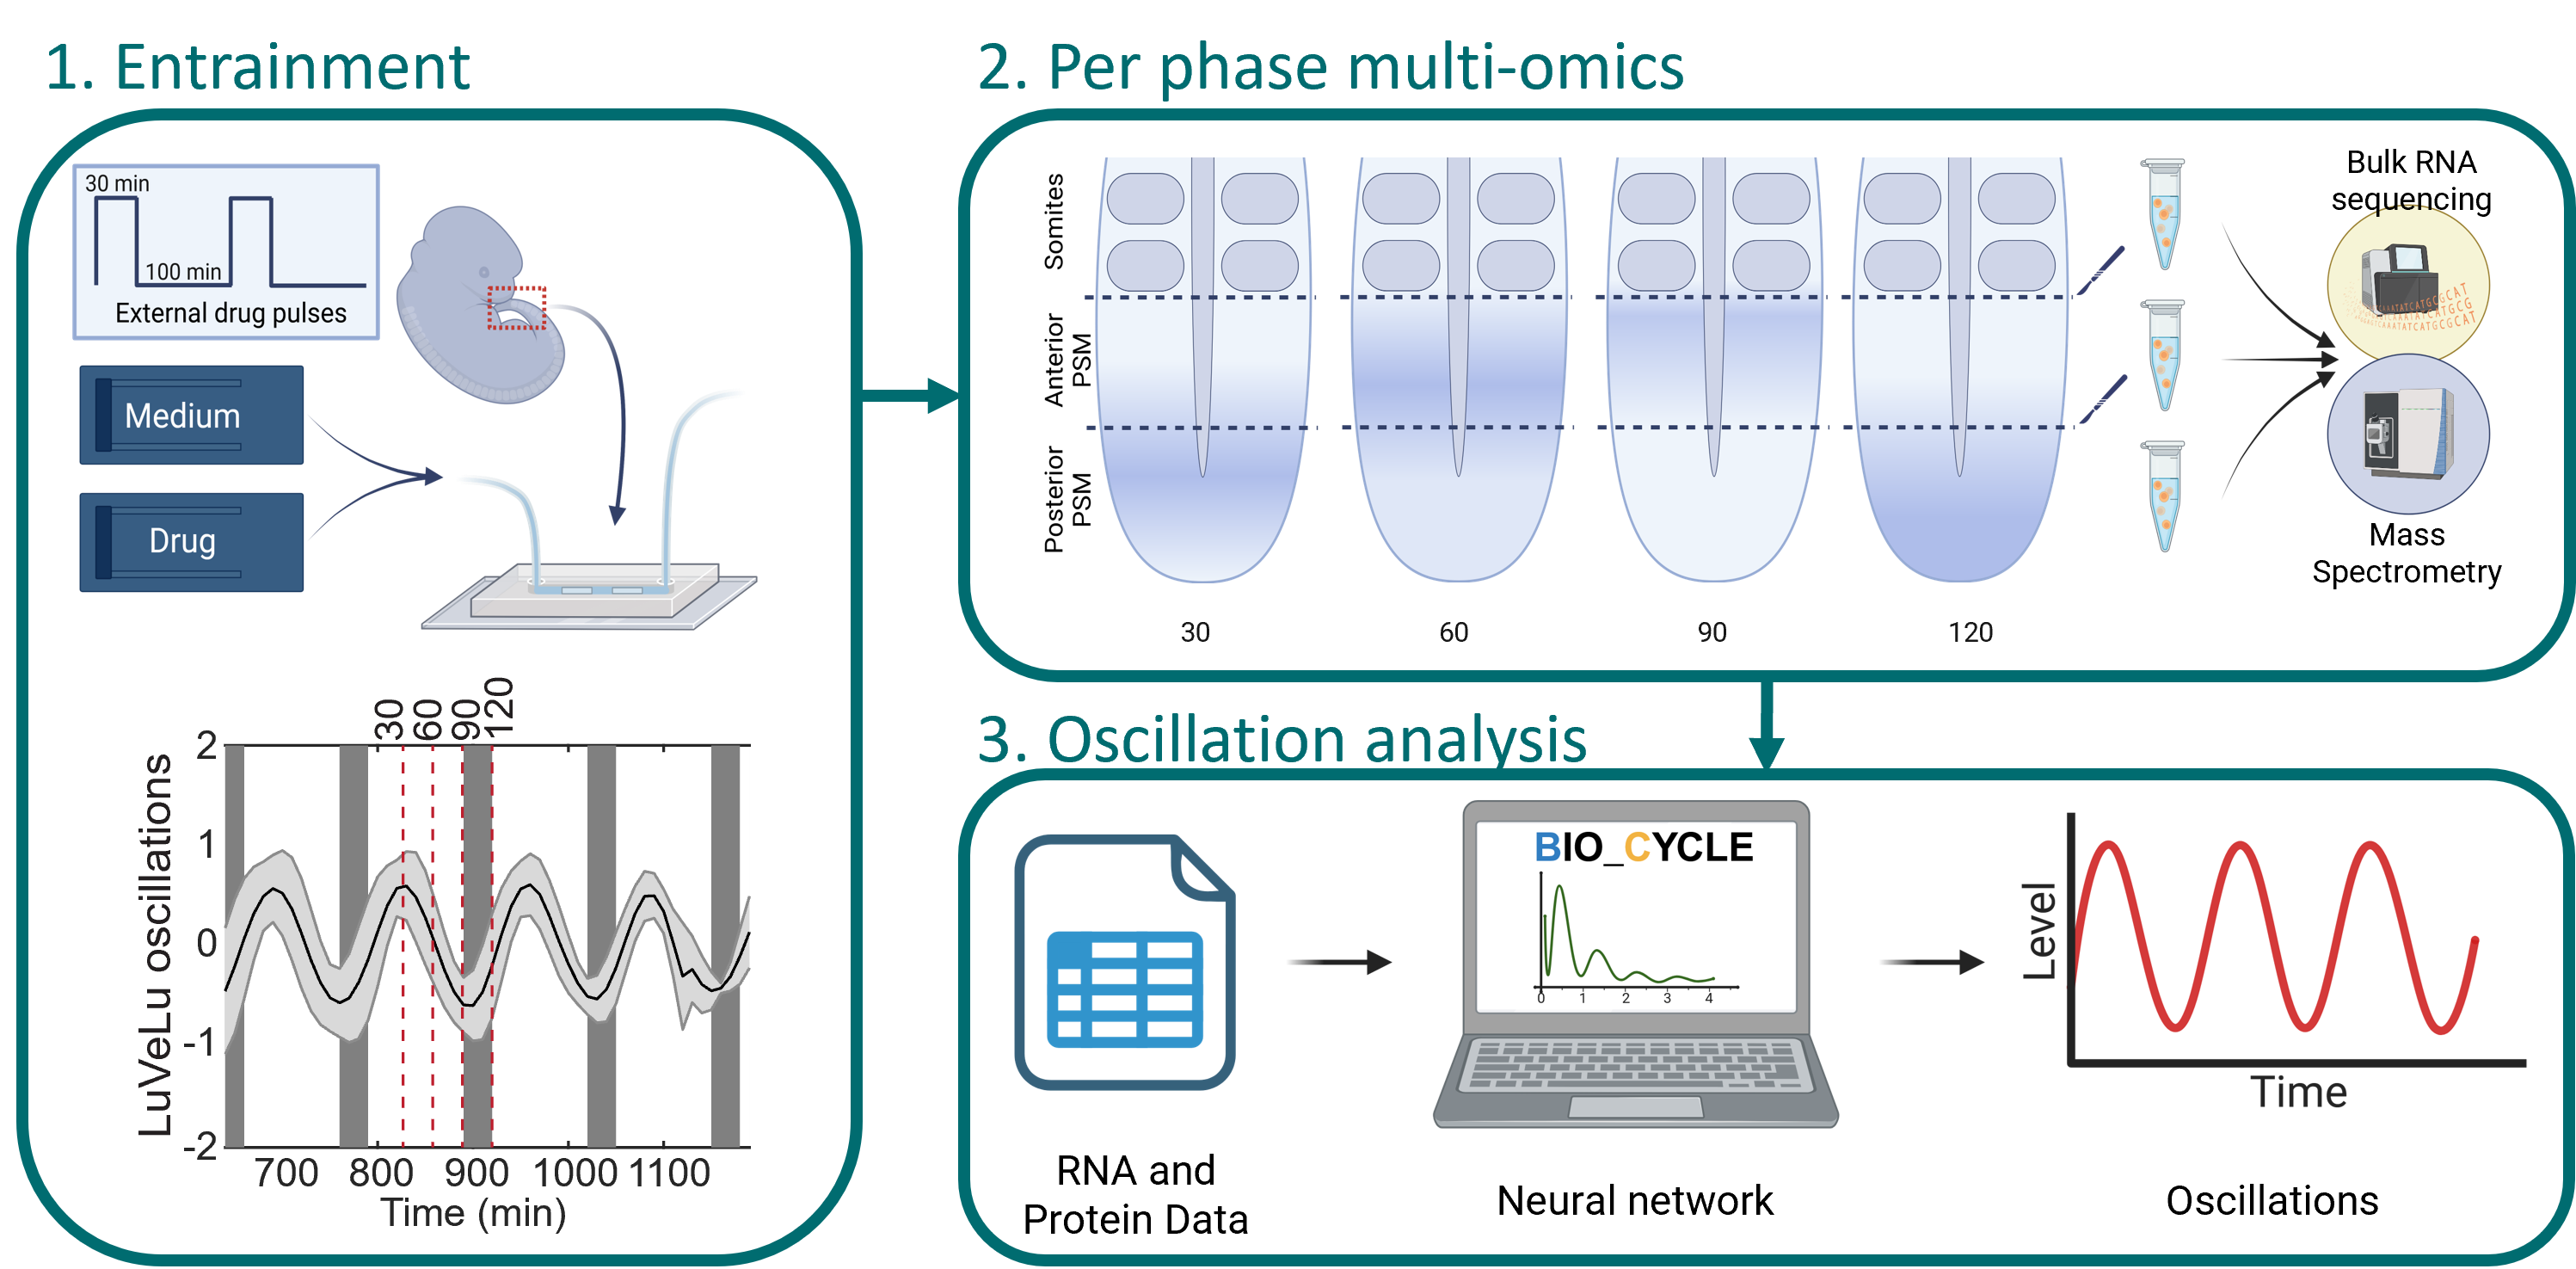
Spatiotemporal methods graphic

Investigating gene expression dynamics during different oscillation phases of somitogenesis

To also investigate the dynamics of gene expression during different oscillation phases, we developed a spatiotemporal method using microfluidic entrainment of tails. We then sent the pooled tails from the same phase for RNA sequencing and proteomics.

The resulting data we analysed using BIO_CYCLE 1, a neural network-based method to identify oscillating genes and proteins. This method allows us to identify potentioal new oscillators on both transcript and protein level.

1 Forest Agostinelli, Nicholas Ceglia, Babak Shahbaba, Paolo Sassone-Corsi, Pierre Baldi, What time is it? Deep learning approaches for circadian rhythms, Bioinformatics, Volume 32, Issue 12, June 2016, Pages i8–i17, https://doi.org/10.1093/bioinformatics/btw243

How it works

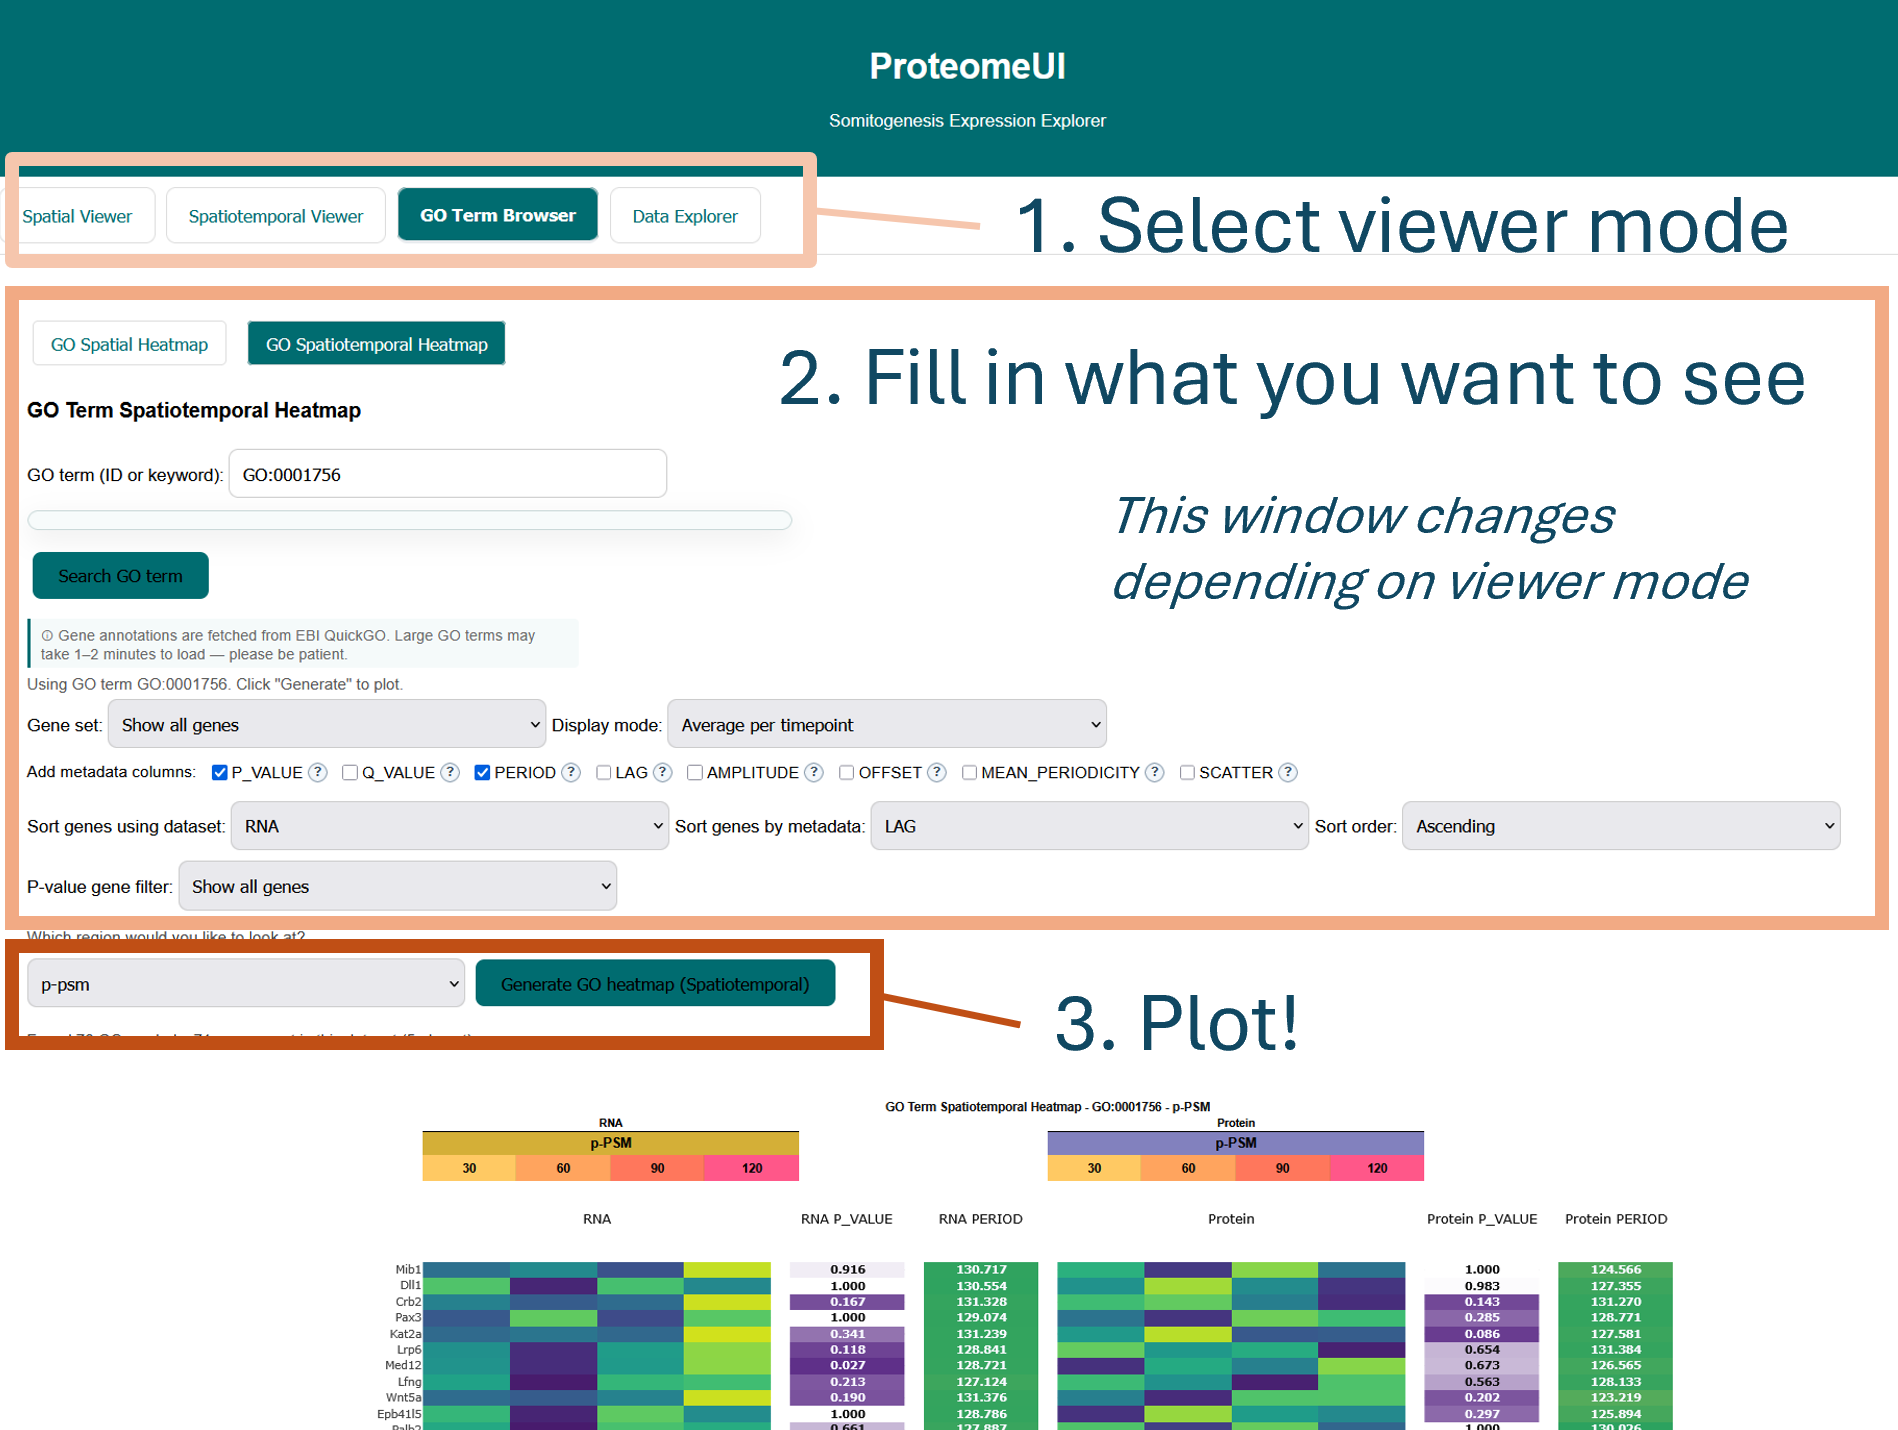
  1. 1. Select the tab you want to use
  2. 2. Input your gene(s) of choice
  3. 3. Generate a plot!

T H E   T A B S


Spatial viewer

Compare RNA and protein expression for one or more genes across posterior PSM, anterior PSM and somite regions.

Spatiotemporal viewer

Check gene expression during the different oscillation phases of somitogenesis for each region.

GO term browser

Interested in general processes? Select your GO term and get an overview of the gene expression, for either spatial or spatiotemporal data.

General data explorer

Explore the broader dataset in one place and inspect expression values across genes, proteins and conditions without preselecting a single analysis view.